America's poorest state rivals Germany: How does GDP per capita compare in the US and the EU?!

The Gross Domestic Product (GDP) per capita of the poorest US state is higher than that of the five major European economies, with the exception of Germany. However, Mississippi competes closely with Germany, with a difference of only €1,500.
GDP per capita, adjusted for Purchasing Power Parity (PPP), in the US also exceeds that of all EU countries, with the exception of Luxembourg and Ireland, which are peripheral. How do GDP per capita figures, both in current prices and adjusted for PPP, in the richest and poorest states of the US compare to European countries, especially the EU and the UK?
We extracted the country's figures for 2024 from the IMF's Global Outlook report, reflecting data from October. We did the calculation for US states using seasonally adjusted data sets from the US Bureau of Economic Analysis (BEA) for Q3 2024 and population estimates from the US Census Bureau as of July.
In the third quarter of 2024, GDP per capita in the US ranged from €49,780 ($53,872) in Mississippi to €246,523 ($266,787) in the District of Columbia. Ultimately, West Virginia ($56,554), Arkansas ($56,917), Alabama ($58,061) and South Carolina ($59,375) followed Mississippi.
Among the top five countries, New York (€107,485), Massachusetts (€101,666), Washington (€99,844) and California (€96,836) followed the District of Columbia. Figures are presented in US dollars in the chart. For the EU in 2024, GDP per capita ranged from €15,773 in Bulgaria to €125,043 in Luxembourg. The EU average was €40,060, while the US average was €80,023 ($86,601).
Among Europe's top five economies, Germany recorded the highest GDP per capita at €51,304, followed by the UK at €48,441 and France at €44,365. Italy was €37,227, while Spain recorded €33,070. The top five European economies are defined by their total economic size, not GDP per capita.
Mississippi comes close to surpassing Germany's GDP per capita
These figures show that the GDP per capita in Mississippi, the poorest state of the USA, is higher than in the main economies of Europe, with the exception of Germany, where it does not have 1524 euros. Germany ranks as the third largest economy in the world in 2024, contributing 24.3% to the total GDP of the EU.
Mississippi's GDP per capita is significantly higher than the other four major European economies, surpassing Spain at €16,710, Italy at €12,553, France at €5,415 and Great Britain at €1,339. The second poorest state, West Virginia, had a GDP per capita significantly higher than all five European countries, surpassing Germany at €5,270
How do rankings change with PPP adjustments?
Purchasing power parities (PPP) are indicators of price level differences between countries. "PPPs tell us how much a given amount of goods and services costs in different currency units in different countries," explains Eurostat. When GDP per capita is adjusted for PPP, both the figures and the rankings change significantly. According to the IMF, which converts these figures into US dollars, GDP per capita in the US is $86,601, compared to the EU average of $62,660.
GDP per capita in PPP terms is higher in the US than in all EU countries and the UK, with the exception of Luxembourg and Ireland, which are considered lower. However, the gap between the United States and European countries narrows significantly under PPP arrangements. For example, Germany's GDP per capita, which is $55,521 at current prices, rises to $70,930 when adjusted for PPP.
This suggests that the ranking between US states and European countries also varies accordingly. For a fair comparison, regional price parities (RPPs) for US states should be considered. RPP covers all consumer goods and services including housing rents.
According to the BEA, in 2023, the RPP in Mississippi was 87.3, compared to the US average of 100, indicating that the cost of living in Mississippi was 12.7% lower than the national average. Applying this rate to Q3 2024, GDP per capita at PPP could be approximately $60,714, although changes in definitions may affect the calculation. In this scenario, Mississippi's GDP per capita in PPP would likely fall slightly below the EU average, but would remain higher than Spain's.
Why are Luxembourg and Ireland considered outliers?
According to Eurostat, Luxembourg's high GDP "is partly explained by the fact that a large number of foreign residents are employed in the country and thus contribute to its GDP, while they are not part of Luxembourg's resident population." . Dr Tom McDonnell, co-director of the Nevin Institute of Economic Research, said Ireland's GDP is being distorted by the tax planning activities of US multinationals.
GDP represents the monetary value of all final goods and services produced within a country during a given period. It serves as a key indicator to measure the size and growth of a country's economy. GDP per capita is commonly used to compare countries, while GDP per capita adjusted for PPP provides a fairer basis for comparison. Disposable income, along with average and median wages, are also used for a fair comparison.

What are the best European countries to invest in property in 2025?
Property investment has never been so hot in Central and Eastern European countries, with Lithuania and Hungary offering the best return on investment for......

VAT, a tax that fills the budget, collection on the rise - In 2025, 236 billion lek are expected to be collected, 10% more than in 2024
VAT, the tax which realizes almost half of fiscal revenues, is expected to collect 10 percent more money in 2025. The budget planning is based on the......

Greenland seeks independence - Prime Minister plans to secede from Denmark through a referendum
Greenland's prime minister has called for the country's independence from Denmark, following US President Donald Trump's comments on the island's purchase.......

Economic growth 2025-2027, how does the productive sector affect? - The forecast for the expansion of the economy is based on consumption
Country of production or simply consumer? We find the answer for the future in the government's plans for economic growth in the next three years. According......

Officially, the US will sanction the Serbian oil company Serbian President Vučić: an American official confirmed to me
The Serbian President, Aleksandar Vučić, has confirmed that the US Undersecretary of State for Economic Growth, Energy and Environment, Jose Fernandez, has......

Moldova, "in a security crisis" - According to the prime minister, the gas cut could strengthen Russian influence in the region
Moldova is facing a security crisis after gas supplies were cut off in pro-Russian regions, leading to power outages and closed factories. The Moldovan Prime......

Montenegro discusses ways to curb illegal weapons after mass killings that left 12 dead!
A high-level meeting in Montenegro has begun looking at ways to curb illegal weapons after a gunman shot and killed 12 people in the second such tragedy in......
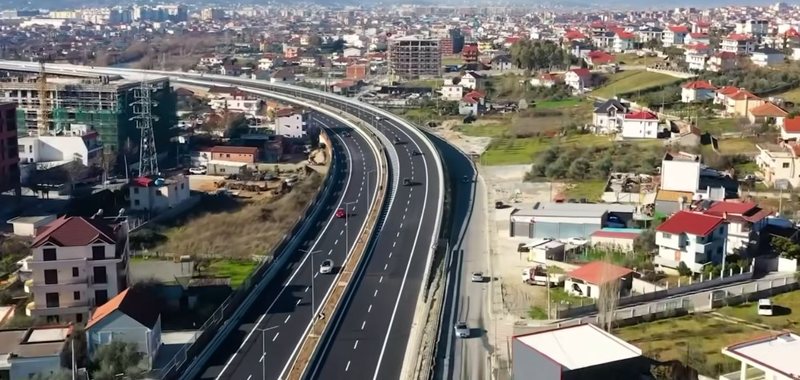
Rama shares the views from the Great Ring of Tirana: Main artery for the capital!
The opening for circulation of the Great Ring of Tirana has recently been the topic of the day. The Prime Minister of the country, Edi Rama, this Saturday......